visustat_summary
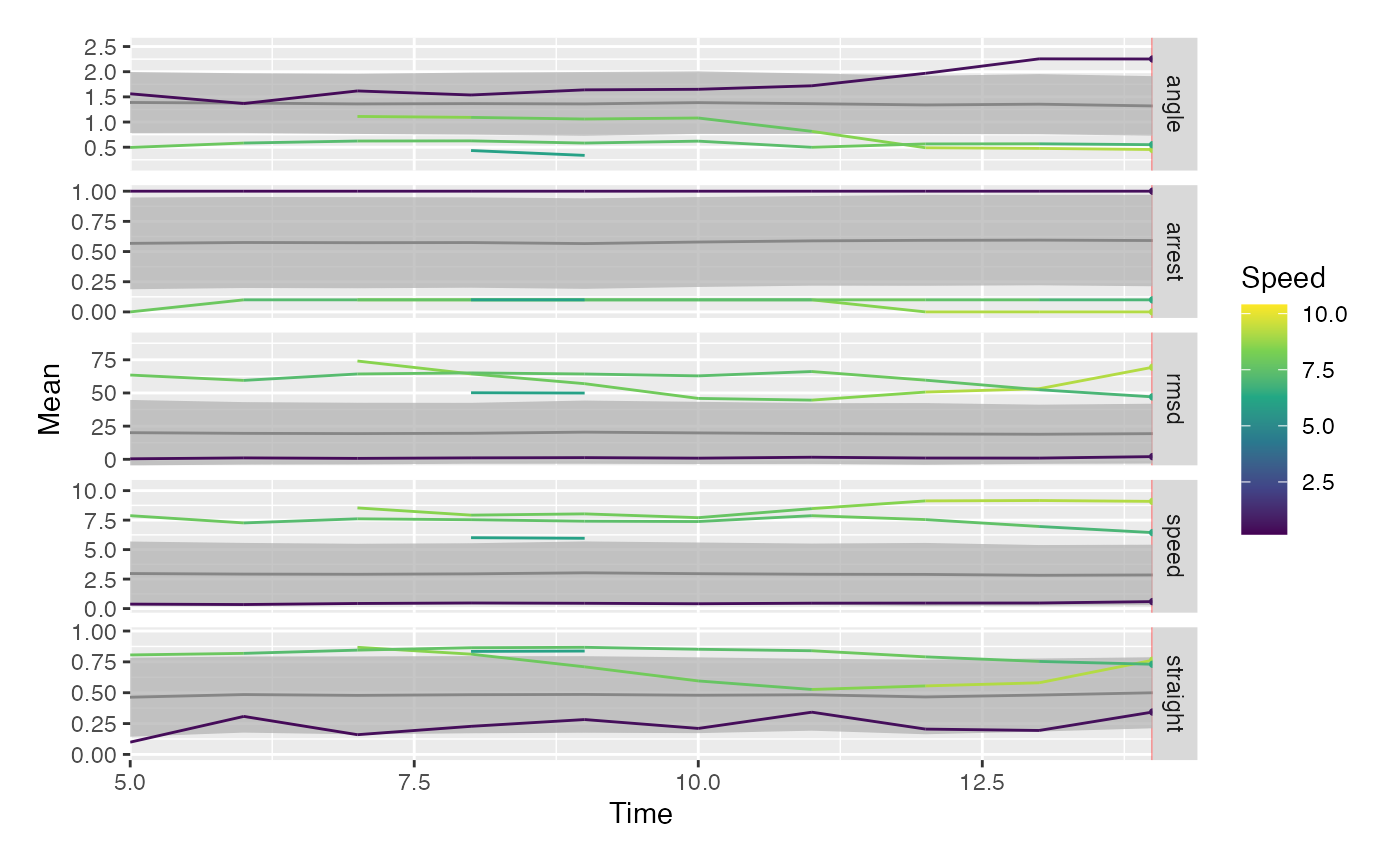
visustat_summary.RdWith visustat_summary, time-resolved summary statistics are calculated. In correspondence to visustat_frame continuous and discrete parameters can be mapped individually on color and shape.
In addition, the population mean and either standard deviations, confidence intervals or standard errors for respective statistics can be displayed as facetted ribbon plots.
Arguments
- df
dataframe of the form:
df(track, time, X, Y, mapping_parameters, ...)- frame
integer: frame to be mapped- time.unit
character: time unit- tracks
vector: defining tracks to be displayed- par.map
character: specifying parameter indfto be visualized by color- par.shape
character: specifying parameter indfto be mapped on shape- ribbon
logical: display ribbon- ribbon.stat
character: choose ribbon-statistic:'sd': standard deviation,'se': standard error,'ci': confidence interval- line.size
numeric: size of lines- line.alpha
numeric: transparency of lines- line.length
numeric: length of lines (in frames)- points.size
numeric: size of points- points.alpha
numeric: transparency of points- points.shape
numeric: set shape from ggplot2 shape palette- unit
character: setting name of unit; default:'px'
Examples
data(hiv_motility)
visustat_summary(hiv_motility %>% na.omit(), par.map="speed", tracks=c(48, 66, 102, 108))
#> frame not specified, defaulting to latest frame in dataset: 10
#> Warning: pars.numeric not specified, assuming the parameters to be: speed, angle, arrest, rmsd, straight
#> Warning: `rename_()` was deprecated in dplyr 0.7.0.
#> Please use `rename()` instead.
#> This warning is displayed once every 8 hours.
#> Call `lifecycle::last_lifecycle_warnings()` to see where this warning was generated.
#> Warning: `mutate_()` was deprecated in dplyr 0.7.0.
#> Please use `mutate()` instead.
#> See vignette('programming') for more help
#> This warning is displayed once every 8 hours.
#> Call `lifecycle::last_lifecycle_warnings()` to see where this warning was generated.